EloqKV Monitor Overview
The EloqKV monitoring framework is an integral part of maintaining and optimizing the performance and reliability of the EloqKV distributed key-value store. Monitoring is essential for understanding the health of the system, diagnosing issues, and making informed decisions about scaling and optimization. To achieve comprehensive monitoring, EloqKV integrates two widely used open-source projects: Prometheus and Grafana.
Prometheus is utilized to collect, store, and query monitoring and performance metrics. It is a robust time-series database that excels at handling high cardinality and dimensional data, making it ideal for a distributed system like EloqKV. Grafana is employed to visualize these metrics, providing a powerful and flexible platform for creating dynamic and interactive dashboards.
Overview of Components
Prometheus: Data Collection and Storage
Prometheus plays a critical role in the EloqKV monitoring framework by collecting and storing time-series data related to various aspects of the system’s performance. It is designed to pull metrics at regular intervals from the EloqKV server, which records various performance indicators and system metrics.
Key Metrics Collected by Prometheus
- Cluster Nodes Information: Prometheus collects information about each node in the EloqKV cluster.
- Command Operations Per Second (OPS): This metric tracks the number of commands processed by the EloqKV cluster per second, providing insights into the system’s load and responsiveness.
- Command Latency: Measures the time taken to process concurrent commands, which helps in identifying performance bottlenecks and optimizing system efficiency.
- Memory Usage: Prometheus monitors the memory consumed by EloqKV on each node.
- Cache Hit Ratio: This metric shows the percentage of requests served from the cache versus those requiring a persistent data storage lookup.
- Remote Request Latency: Tracks the time taken to fulfill requests that require communication with remote processes or nodes, i.e. WAL log latency or remote read request.
Grafana: Visualization and Dashboards
Grafana serves as the visualization layer of the EloqKV monitoring framework. It provides a flexible and powerful interface to create, explore, and share dashboards based on the data collected by Prometheus. Grafana’s rich feature set allows users to transform raw data into meaningful insights through interactive and dynamic visualizations.
Features of Grafana in EloqKV Monitoring
- Custom Dashboards: Grafana allows the creation of custom dashboards tailored to specific needs base on the pre-defined dashboards which already includes real-time monitoring of node health, command throughput and latency and the trend of memory usage.
- Interactive Exploration: Grafana’s dashboard allows users to drill down into metrics, apply filters, and explore data over different time ranges, making it easier to diagnose issues and uncover trends.
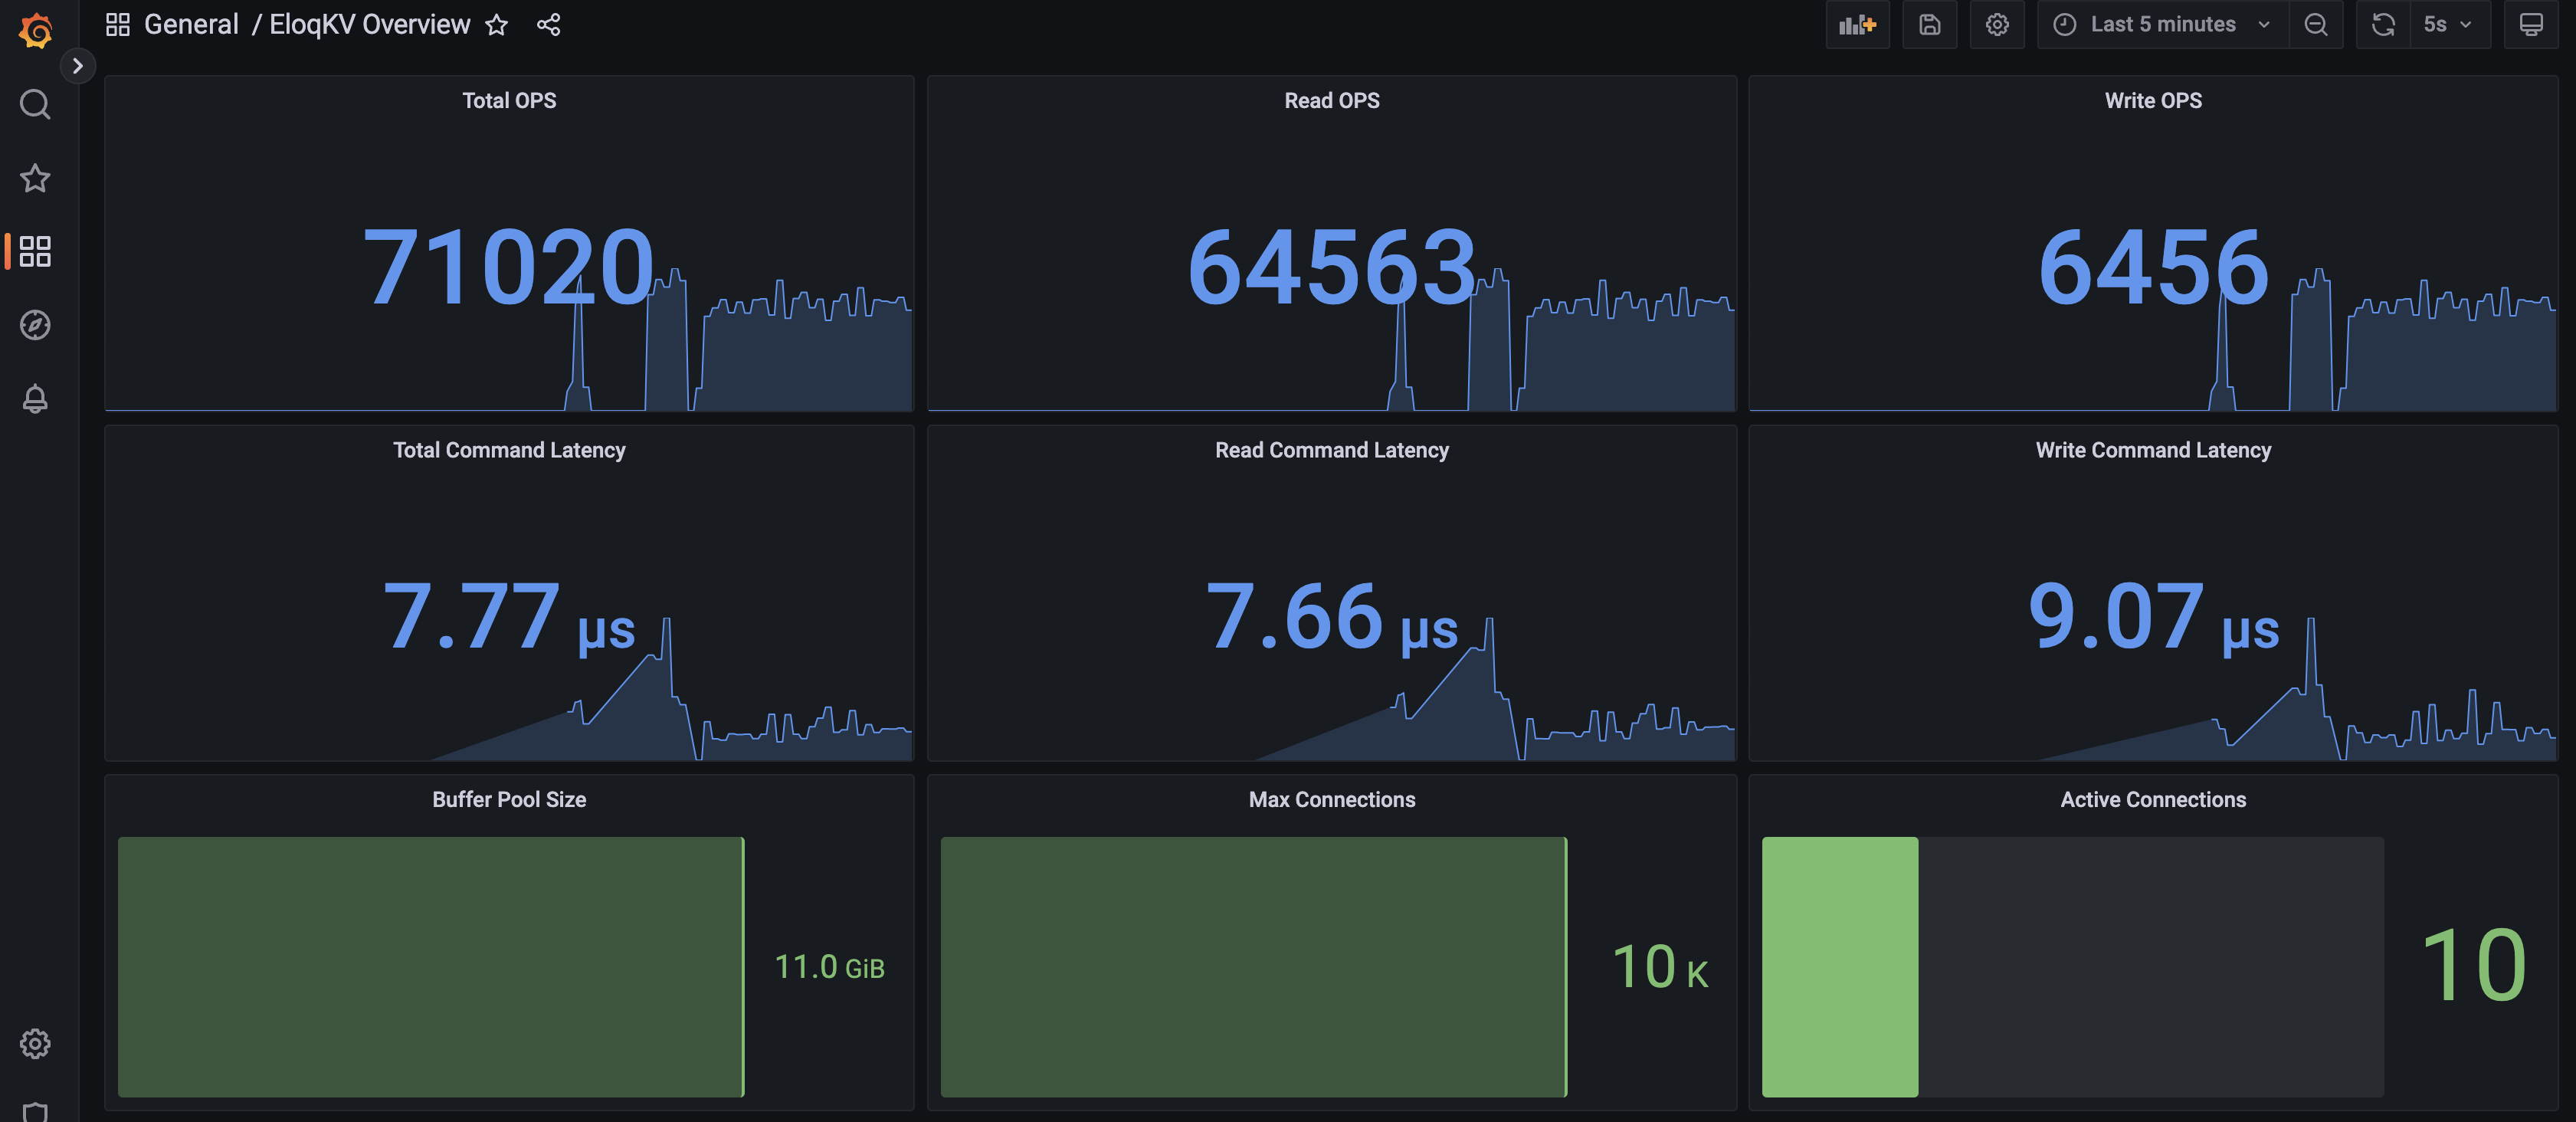
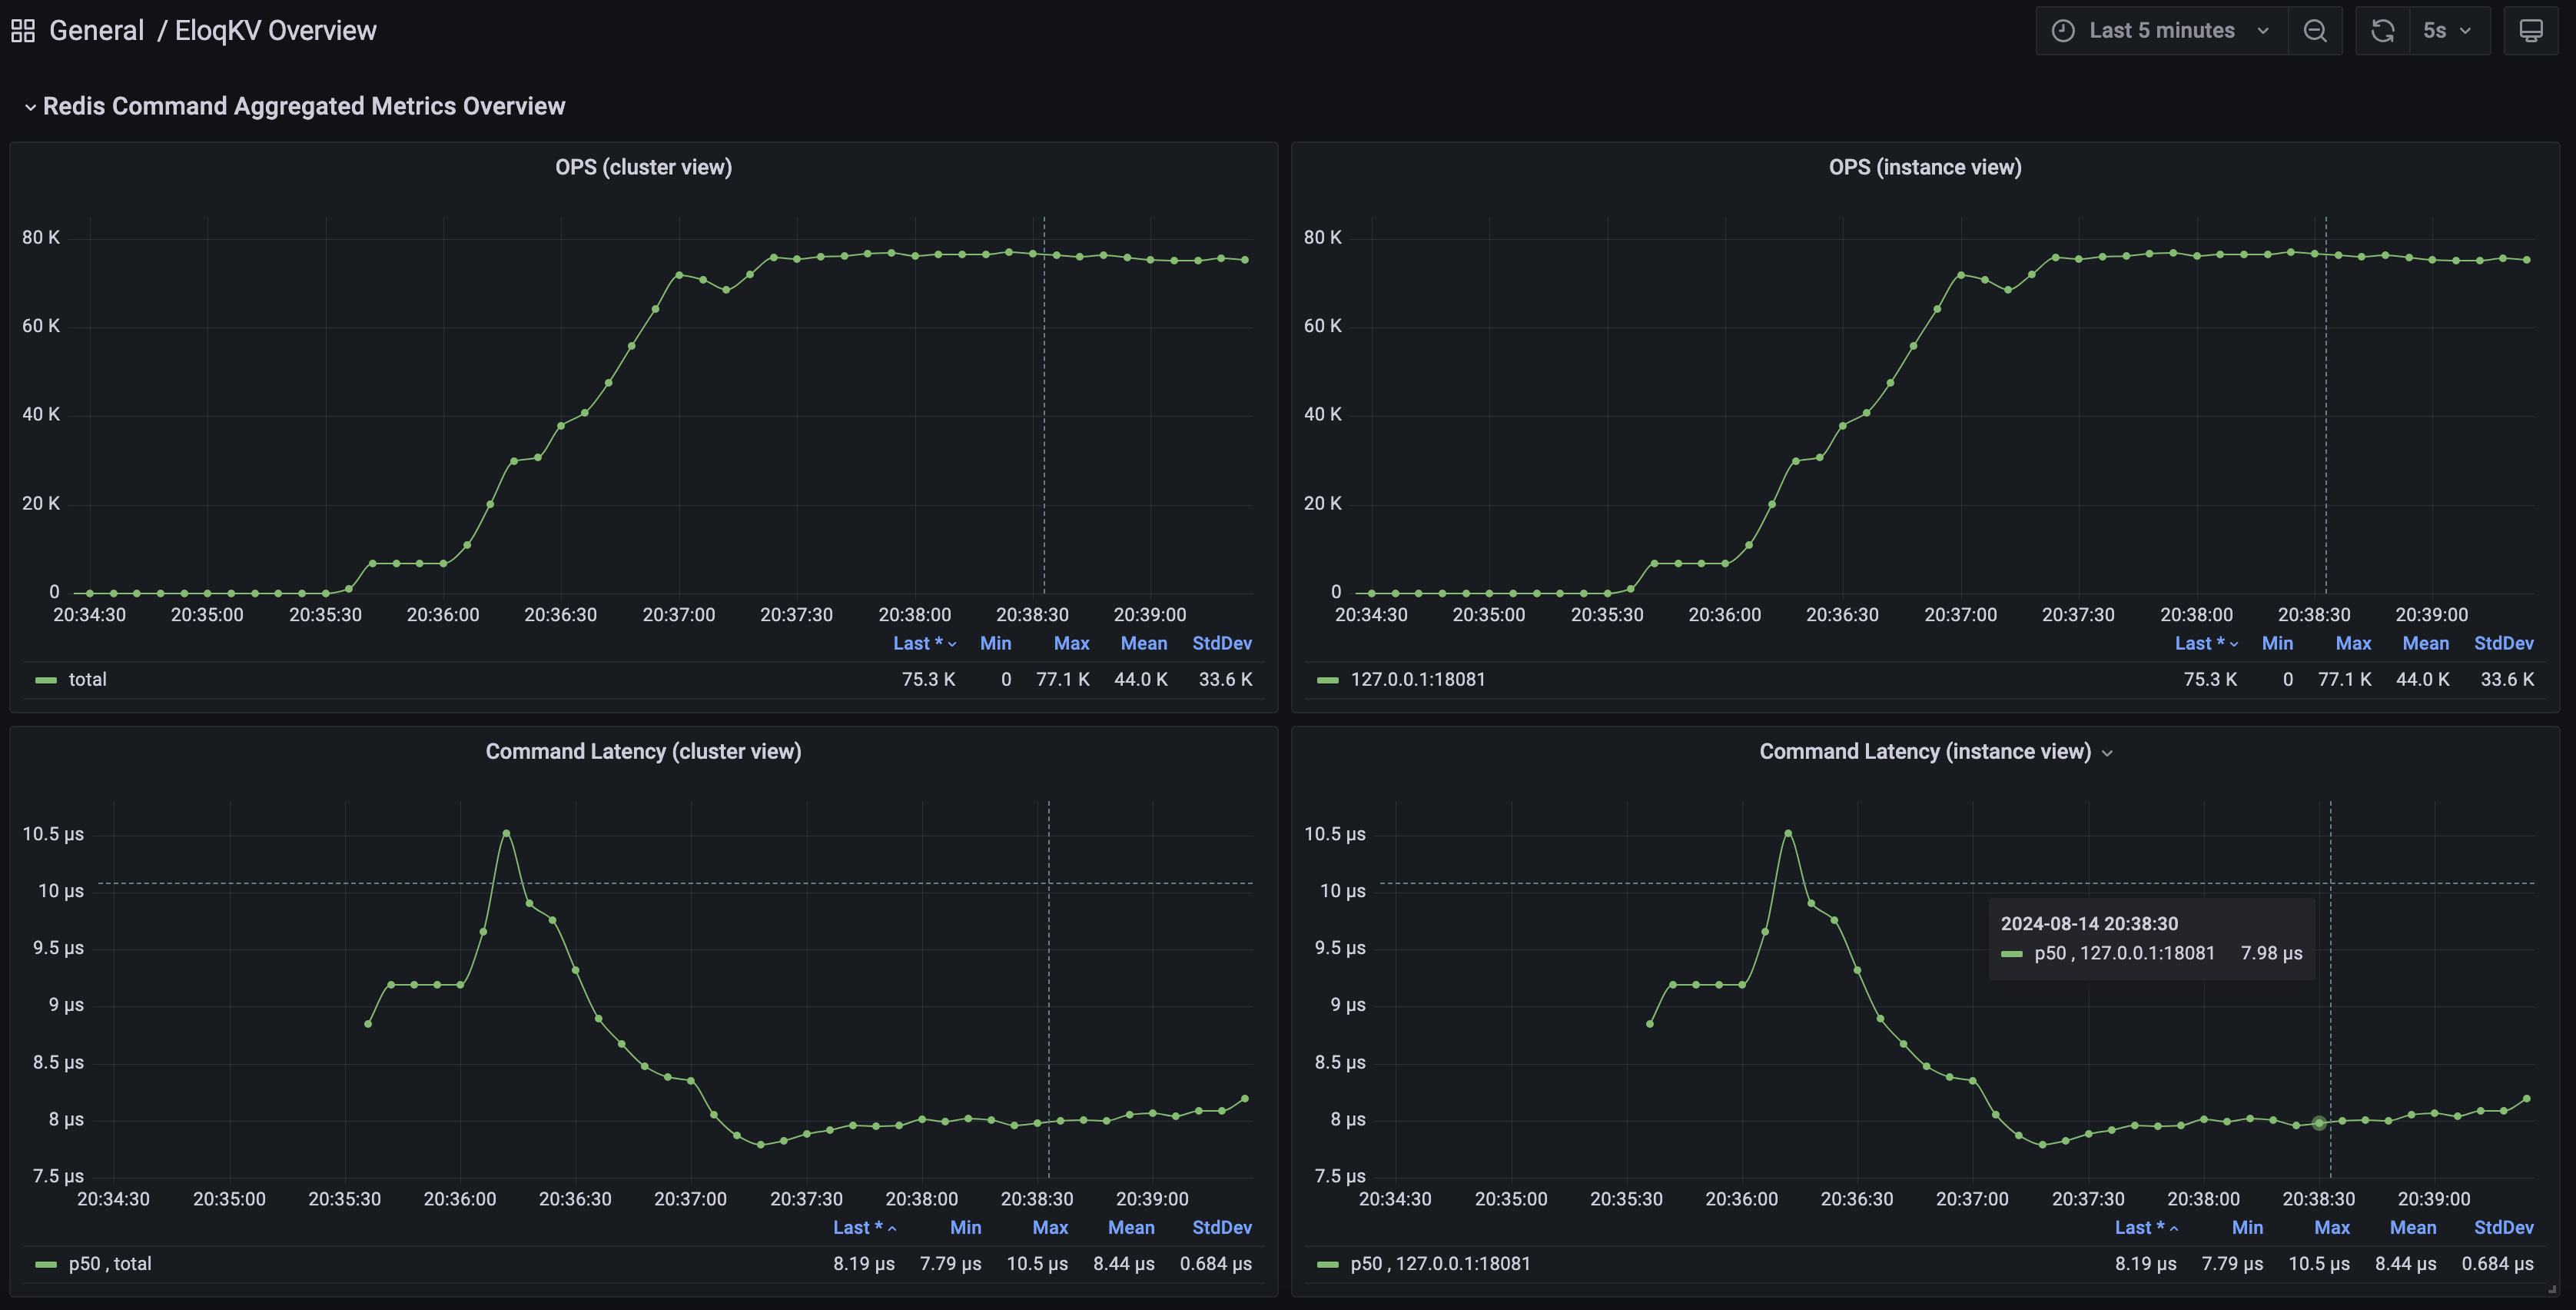
Here's what the EloqKV Grafana interface looks like: